This article goes in-depth in both explanation, debugging and resolving high Total Blocking Time (TBT).
TOC
- What is TBT?
- How is TBT measured?
- What is a good TBT score?
- How can I debug TBT?
- How can I fix TBT?
- Summation
- Resources
What is TBT?
The Total Blocking Time (TBT) metric measures the total amount of time between First Contentful Paint (FCP) and Time to Interactive (TTI) where the main thread was blocked for long enough to prevent input responsiveness.
– Philip Walton, https://web.dev/tbt/
More simply, TBT is the time between a user seeing something and being able to interact with it.
Or, other words, it is the time that your code prevents a user from interacting with your page…
An example would be when a page is loading in your browser, you see something you want to interact with (to click, swipe, scroll, etc.), but when you try, the page just sits there.
How is TBT measured?
TBT is a lab metric that is calculated by measuring “tasks“.
A task is anything that the browser has to do to get the page ready for the user. This could be downloading and parsing HTML, download and parsing CSS, downloading and evaluating JS, setting up event listeners, fetching additional resources, or anything really. If the browser has to do something, we call it a “task”.
And the tasks we specifically care about, with regards to TBT, are tasks that take longer than  0ms. These are cleverly referred to as “long tasks“.
To calculate TBT, we look at all the tasks that happen between FCP and TTI, and add together any time that each is over 50ms.
For a visual example, here we see the main thread and five tasks that the browser has to perform (it doesn’t matter what the tasks are, if they are still running, the user interaction is blocked):
 Image courtesy of web.dev
Note that the first two and the last tasks all take longer than 50ms:

Image courtesy of web.dev
These “overages”, indicated in red in the above graph, are tallied to determine the TBT: 200 + 40 + 105 = 345ms.
To better understand why long tasks are so painful, we have to remember that CSS and JS are blocking, meaning that, while they are working things out, nothing else can happen.
This means that, if a task takes 250ms, and perhaps 20ms into that task the user clicks a link, that click cannot be processed for another 230ms.
From the user’s perspective, they clicked something but nothing happened. We’ve all been there, and it is frustrating.
What is a good TBT score?
A good TBT score is below 200ms.
 It is not easy to get a score there, but it is doable.
For more specific details, consult our Performance KPIs documentation.
How can I debug TBT?
There are many ways to debug TBT, but this article will focus on using Chrome’s DevTools.
If you need help with another tool, please let us know and we can try to help.
Recording a Performance Profile
To record a performance profile:
- Open Chrome and navigate to the URL you want to debug; for this example, we will use:
https://m.maccosmetics.com/bestsellers - Open DevTools and click the Performance tab; you should see something like this:
(Don’t worry if yours looks slightly different. For example, you may not use dark mode, or you may align your panel across the bottom, etc.)

- Here are the important bits so far:
 1. Record: This starts a new recording exactly where you are (once started, this becomes the Stop button).
2. Record & Reload: This starts a new recording with a fresh page load.
3. Clear: This clears any current performance recordings from the screen.
4. Capture options: These are options for what you will see on your screen (you will understand why you might want to limit these shortly…). - Click the Record & Reload button; your Performance panel should get a message similar to this in the center:
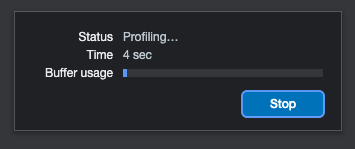
- Note the Time incrementing. This allows you to determine when to click the Stop button.
If you are trying to debug a specific issue happening on your site at roughly the same time, you can let it record until that time so you can try to debug that issue.
Otherwise, I typically stop the recording at about 10-15s. - After you click the Stop button, you will see a screen similar to this:

At some point, the word “Loading” will change to “Processing”. -
And once DevTools has finished processing the performance data that it collected, your panel should automatically change to something like this:
 To make a little more room for yourself, you can unchecked the Screenshots, Memory and Web Vitals checkboxes at the top of the Performance panel, and drag the borders between the remaining sections around as you need.
 -
Ok, so, take a breathe…
This is a lot of data, we don’t need all of it for this topic, and we will walk through the parts that will help with debugging TBT below…


Reading a Performance Profile
The main sections to use for debugging TBT are the CPU chart at the top of the Performance panel:
![]()
the Flame chart near the bottom:

and the the Bottom-Up tab in the bottom section:

For a high-level look into all of the other sections, Mike Diaz offers a good explainer article.
A few quick notes about these three sections of the Performance panel:
-
In the CPU chart, note these two “handles”:

These handles let you “crop”, or “zoom in” to, a portion of your profile, so you can focus on a specific part of the loading experience.
This cropping also adjusts the other charts, so they become a little more readable, and usable, like this:

The entire width of the Flame chart is now focused only on the portion you have focused in the CPU chart. -
You can also click and drag your mouse across a section of the timeline to move both of these handles at once:

- The colors in both of the above charts correlation to one another:
- Blue is related to HTML. Usually parsing.

- Dark Purple is related to CSS. Either the browser is first laying out the page or something has triggered a repaint.

- Yellow is related to JS. Could be evaluating, parsing, processing, etc.

- Blue is related to HTML. Usually parsing.
- Note how the Flame chart consists of several sort of “columns”, which are read top-down:
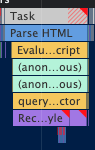
At the top of each column is a gray bar that says Task. (Remember discussing a Task, and more importantly, a Long Task earlier? These are them!)
The example above says this Task consisted of parsing some HTML, and the parsed HTML involved evaluating some JS, which consisted of a couple anonymous scripts, followed by a querySelector, which triggered some layout recalculations.
Now note the red hash lines in the Task bar and the little red “corners” in the Task bar and the Recalculate bars.
The red hash lines indicate the portion of the Task that is considered “Long” (greater than 50ms), and the red corners indicate there is some problem with this part of the Task; hovering over them provides additional info:


-
Note the Bottom-Up tab settings, specifically the “Group by Activity”, this will help you debug:

This tab is called Bottom-Up because each grouped activity is listed in “upside-down” order, meaning it happened “from the bottom, up”:

In the above example, if you start reading from the bottom, you might recognize the Flame chart explanation from above: Some HTML was parsed, that HTML included a script, which included two anonymous functions, which included a querySelector, which triggered some style recalculations…
Note that you can also click the link to the right to see the actual code that triggered this in the Sources panel.
I clicked the link titled bestsellers:11291:9, which took me to the anonymous script in the /bestsellers page that starts on line 11291 , column 9:

- Finally, back up in the CPU and Flame charts, note that the first Task is always related to recording the Performance Profile itself, and should thus be ignored when debugging:


How can I fix TBT?
The first goal should always be to reduce the code we send to the user:
- Split JS bundles so that each page only downloads what is needed for that page. Something like loadJS might also help, by loading only the code needed for “this” page, based on DOM elements.
- Analyze JS bundles for redundant code so the same code is not downloaded multiple times.
Once that is done, the “simple” solution to fixing TBT issues is to break large tasks into small tasks.
Of course, that’s a lot easier said than done…
But that is the crux of the solution. We need to find Long Tasks, then figure out how to break them into smaller Tasks that can complete more quickly and allow things to happen between them.
Find the problem
- Unless you have a specific area that you know you want to debug, a good place to start is just looking for those red hash lines on the Task bars. After all, TBT is the accumulation of all of those red hash lines. If we get rid of all of the red hash lines, our TBT should be 0!
- There are two schools of thought when going after the red hash lines:
- Start at the the left and work your way right, and
- Start with the biggest patches of red hashes and work your way to the ones with fewer red hashes.
- From a performance point of view, attacking the largest ones first makes the most sense: several Long Tasks that are just slightly longer than 50ms are a lot better than fewer Long Tasks that are a lot longer than 50ms.
Why? Because other tasks, like user interactions, can jump in between the shorter Tasks, but have to wait until the longer Tasks are completely finished. -
So, let’s pick a Long Task.
Looking at the entire Profile, the longest Task is obvious:

This highlighted Task takes 1.55s to complete, which means that, for nearly 2s, no user interactions could be processed; anything clicked, tapped, swiped or scrolled, would likely just sit there. -
So once you find a Long Task that you want to investigate, click that Task bar (the highlighted section above) and take a look at the Bottom-Up section:

-
A quick look tells us that 96.5% of that nearly 2s is related to JavaScript, so let’s expand that:

- Oof… That’s a lot of JS, and notice that the scrollbar for that list has a lot more to scroll to…
- So next we look for a large Total Time to investigate. The first really large time we come to is an anonymous function that take 1470.6ms:

Expanding that we find a function named o that took 12.1ms and another anonymous function that took 1458.5ms.
Expanding that longer anonymous function, and expanding all the way up the Call Stack, we end with a Timer Fired that took 1443.5ms to complete. That is our Long Task.
We can then click the reference link to the right of that task to see what this function is (ask DevTools to Pretty Print the file, if necessary):

- One challenge with debugging modern day JS is that files are typically minified and/or obfuscated, so determining the exact process might be hard.
- But based on the above method name (startService), you can begin researching what calls this.


Fix the Problem
- Once again, the goal is to break long functions into smaller functions, so we are looking for functions that take a long time, like loops of large datasets or functions that call a lot of other functions.
-
It is important to note that a single function that calls multiple functions is still considered a single Task. For example:
const init = () => {
    func1(); // takes 5ms
    func2(); // takes 5ms
    func3(); // takes 5ms
    func4(); // takes 5ms
    func5(); // takes 31ms
}
init(); // takes 51ms
Although the
initfunction does nothing but call five other functions, it is considered a single Task, and once started, cannot be interrupted.
Meaning, if the first four functions complete in a total of 20ms, but the last one takes 31ms, then theinitfunction will be considered a Long Task, because in total, it took 51s to complete.
The problem is the same even when using a Promise, like:const init = () => { Promise.resolve() .then(func1) // takes 5ms .then(func2) // takes 5ms .then(func3) // takes 5ms .then(func4) // takes 5ms .then(func5); // takes 31ms } init(); // takes 51ms -
If, however,
initis broken apart and each function is called individually, that Long Task disappears, because all complete in less than 50ms.func1(); // takes 5ms func2(); // takes 5ms func3(); // takes 5ms func4(); // takes 5ms func5(); // takes 31ms
And, again, the big benefit here is that any user interaction can interject into the call stack between any one of the five functions, whereas when they are all wrapped within the init function, no user interaction can be processed until all of the five functions are complete.
-
This can be vizualized with the following graphics:

Images courtesy of web.dev
Note in the first graphic, there are five functions wrapped into a singlesaveSettingsfunction. Any user actions taken whilesaveSettingsis running will have to wait until all five functions finish before they can be processed. This results in one Long Task.
Now note in the second graphic, where the five functions are called separately. Here, user actions can be processed between these functions, and there are no Long Tasks that block the main thread. -
There are several approaches that can help reduce main thread blocking…

setTimeout
The “old school” approach was to use setTimeout, something like:
const init = () => {
    setTimeout(func1, 0); // takes 5ms
    setTimeout(func2, 0); // takes 5ms
    setTimeout(func3, 0); // takes 5ms
    setTimeout(func4, 0); // takes 5ms
    setTimeout(func5, 0); // takes 31ms
}
init(); // a couple ms, all functions are non-blocking
Note how each function within init is wrapped with a setTimeout. Even waiting 0ms is enough to remove these functions from the main thread, allowing init to complete almost instantly.