The latest in a series of posts that investigate problematic performance KPIs on live commercial websites.
Table of Contents
Intro
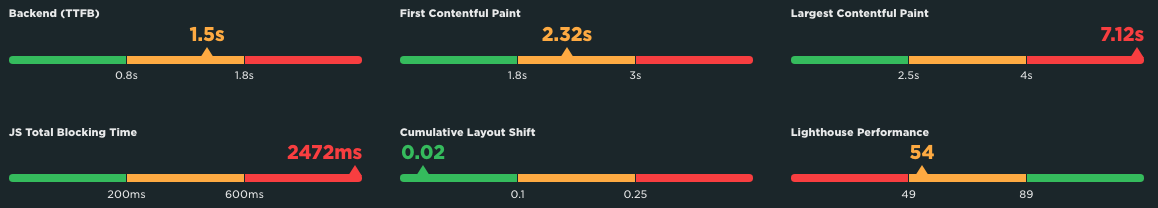
On a recent Speedcurve Page Speed Benchmarks dashboard, when viewing USA > Retail > LCP with a Fast connection, I noticed that Wish.com was reporting a very high LCP: 7.12s:

And, being the curious little bugger that I am, I just had to find out if this issue also existed for real users and, if so, what might be causing, and can it be improved?
Exploring the Issue
Well, I thought I was just going to be investigating a slow LCP. But as soon as I started looking into the page, things started going sideways, really fast…
In addition to the 7.12s LCP, FCP was reporting 2.32s…

…which usually means one thing: client-side rendering.
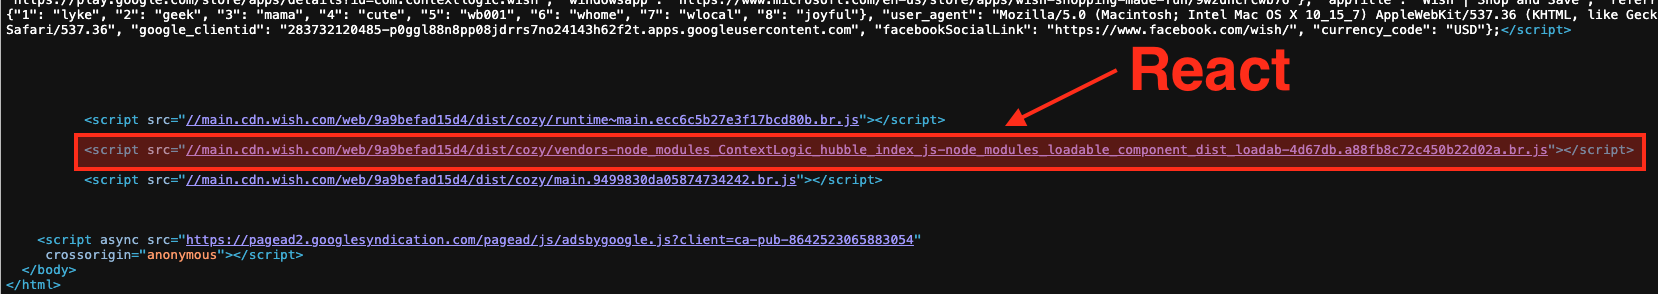
And sure enough, View Source, and…
<div id="react-app"></div>
So, a standard audit step for me is to disable JS and refresh the page anyway, so I did that, and sure enough, nothing. At all. No header, no logo, no menu, nothing. Just a plain white page.
Scrolling through the rest of the View Source revealed there is absolutely no content at all within the initial HTML delivered to the browser (other than a 181kb JSON block, which includes most of the “bits” that React will use to construct the page). The first asset request is for the favicon, then for the manifest.json file, then the cookie consent JS is requested (at least using async), then the last thing in the head is the GTM JS (which is at least added via .insertBefore, so it too is async). After the JSON block, the page wraps up with 3 more JS files (the React stuff) and another ads JS file.
But what is most surprising about this page that has no real content in it is that the TTFB is still reporting at 1.5s (still yellow, but just barely!):
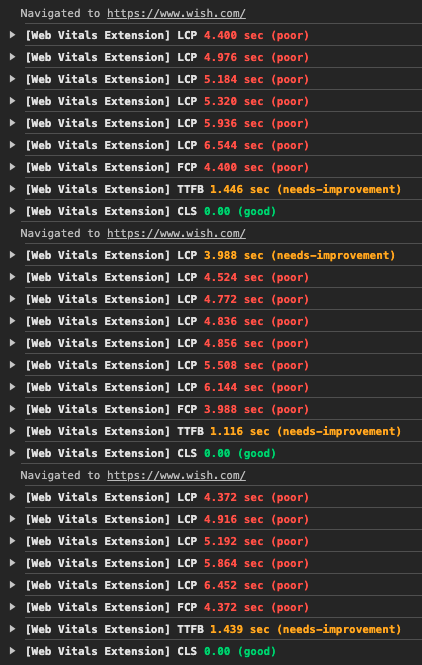
That seems excessive for a page that contains no actual content… Multiple hard-refreshes in my browser all reported TTFB times well over 1s, so there is definitely an issue happening there:
All told, the HTML is only 66kb, but then it downloads a total of 105 JS files, weighing nearly 3.5MB (note that TBT above, almost 2.5s), which in turn downloads 5 CSS files, weighing a total of just 13kb.
But, that CSS is also where the LCP asset is finally referenced, as a background-image, which also happens to be the slowest way to render an image…

So, to summarize:
- The Wish.com home page user experience starts with a TTFB of roughly 1.5s,
- then the browser has to request the React JS files, which are responsible for building all of the page content,
- then the browser has to build and render the entire page,
- including, and likely hindered by, needing to download another 100+ JS, 5 CSS and 4 font files,
- which then also triggers the download of 128 images, weighing nearly 1.5MB, including the LCP asset, when it is discovered within the CSS,
- then the LCP asset, which is a PNG, with no more-performant alternative format offered has to download, with normal priority,
- the mobile version weighing 207kb and desktop 347kb,
- which renders at approximately 7.12s after the user requested the page.
So, is there anything that we can do to improve this?
Well, let’s see…
Improving the Issue
A couple of issues jump out at me, some more problematic than others…
- The biggest issue by far is that the entire page relies on React downloading, processing, building and injecting the HTML. This is a huge delay. And nothing can get started until that finishes. During that time, the user is just staring at a blank white screen.
- There are a lot JS, CSS and image files that need to be downloaded (including the LCP image). The three hero component images are the only ones actually referenced in the in-page JSON block. All other images are part of lazy-loaded JS components, but none of those images are lazy loaded, which is why 125 images immediately download when the page renders.
- And all of that dynamic content building and loading is affected by a total of 105 JS files downloading, processing and trying to execute in a single thread, which is what leads to that almost 2.5s TBT.
- The fact that those three hero component images are all rendered as CSS background-images means they cannot even be requested until the CSS has been injected by React and parsed by the browser. Additionally,
background-imageis the slowest image rendering method, cannot be cached or automatically prefetched by the browser, nor can their fetch priority be increased, and there is noaltattribute, so they are not visible to search bots, AI or screen readers. - There are no Early Hints or
preloadlinks for any of the render-blocking or otherwise-important assets that the page needs, and the CSS-referenced images are undiscoverable by the browser ahead of time. - The page uses several different domains, including one CDN for the favicon and other assets and another for all content images, and still another for the Google fonts, but none have
preconnectordns-prefetchlinks. - While the HTML page (the empty shell) allows bfcache, you get the header quickly, but since there is no content you only get a loading indicator, which just reminds you that you are waiting for React to re-render the content that you were just looking at.
So how do we tackle these issues?
Well, the first thing I would do is include the page content within the initial HTML. If we are already waiting for 1.5s to render the JSON and return it, we might as well wait a little longer and have the actual content already rendered when that page arrives, instead of an empty white shell.
And if SSR/SSG can happen, move the CSS to external files and reference them via link elements, rather than relying on React to provide all of that CSS, something like this:
<link rel="stylesheet" href="/path/to/style.css" type="text/css" media="all">
This will not only give React less to do, but will also allow the server to compress, the browser to cache, and CDNs to deliver, with cache-control headers, all of these files, improving the return-render speed, and probably improving the speed for other pages, assuming at least some CSS is shared across pages.
I would also hope that there is a way to reduce that TTFB. Better database indexing? Page, object or component caching on the server? Caching on the CDN? Maybe even just above-the-fold caching, since most of the lower content is injected anyway?
I also think this page could be an excellent candidate for Early Hints, especially with that TTFB delay. Wish.com might want to try prefetching at least the React JS, ideally also the LCP image, and maybe even other hero component images? This would allow the browser to begin fetching them while waiting for the HTML to arrive, and ideally would already have them downloaded by the time the HTML needs them. Something like this, depending on the server/renderer:
Link: </path/to/react.js>; rel=preload; as=script
Link: </path/to/image/hero.avif>; rel=preload; as=image; type=image/avif; fetchpriority=high
If Early Hints won’t work for some reason, then at least use preload links for these files, as close to the top of the head element as possible, and see if they give a little speed improvement, especially if the HTML is included within the initial document. Something like this:
<link rel="preload" href="/path/to/react.js" as="script" type="text/script">
<link rel="preload" href="/path/to/image/hero.avif" as="image" type="image/avif" fetchpriority="high">
Below is a comparison video with just those changes made to the After version of the page (on the right-side of the video):
Already a pretty tremendous improvement! Note that each video pauses shortly after the above-the-fold content becomes stable, and that the Before video stops at 8:40, and the After video at 3:66… That’s more than a 5-second difference, friends.
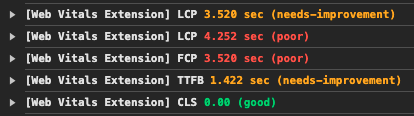
Here are the performance metrics from the Before version:
And here is with just the content moved into the HTML document:
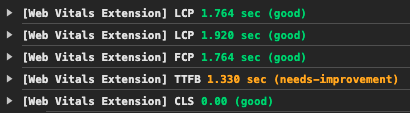
The improvement is clearly visible in those numbers: TTFB is relatively the same; FCP reduces from 3.528 to 1.764; LCP reduces from 4.252 to 1.920!
Continuing with the above changes, and adding Early Hints for the 3 React JS files and the LCP image:
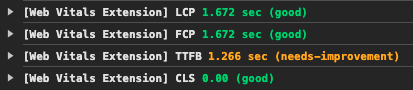
FCP reduces an additional 100ms to 1.672 and LCP reduces an additional 250ms, now matching FCP because it is now included with the initial render (no wait), and also no “initial LCP, then update”…
I also tried swapping the Early Hints for preload links:
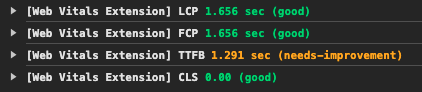
There isn’t much difference between the Early Hints and preload links, so either I configured the Early Hints incorrectly, the server is not configured to handle them, or my browser is not. Since I am using the latest Chrome, my bet would be one of the first two…
Beyond these first couple of steps above, I would also recommend offering multiple versions of all images, at least an AVIF to go with each PNG or JPG. The current mobile image is 207kb and the desktop is 347kb. Converting these two to AVIF resulted in images that were only 30kb and 50kb, respectively. Now consider the savings that kind of reduction would provide for all 128 images, which currently weigh nearly 1.5MB. Ideally this is something the CDN could be configured to handle auto-magically, so the same HTML (/path/to/image.jpg) could be used, but the CDN would send the best image format to the browser, depending on support, connection speeds, size variation, etc.
Speaking of images, I would move those hero component images out of the CSS and serve them the same way all of the other images on the page are served, via standard HTML img elements, which would look something like this:
<img fetchpriority="high" decoding="async" src="/path/to/image/hero.avif" width="1776" height="800" alt="Meaningful text describing the image contents">
Not only does this put the image URLs in the HTML, where the browser can “find” them sooner than in the CSS, but you can request a higher fetchpriority for those important requests, set width and height attributes to tell the browser how much space to reserve for the image, and provide alt text to tell search and AI bots and screen readers what the image is about; this approach also allows the image to be cached by the browser for faster re-paints.
Next, see if there is any way to reduce the number of JS files for the home page… There doesn’t seem to be that much going on that merits 3.5MB of JS. At the very least, perhaps some could be delayed until later, on an as-needed basis? Or switch some of components to RSC, as referenced above, which would reduce the bundle sizes, and maybe help with page rendering speeds. This overall JS reduction would give React a chance to fetch and process what it needs with less thread competition, hopefully reducing that TBT.
And my final recommendation for this quick overview, would be to add preconnect links for any “important” 3rd party domains. Using that definition, I would certainly include both Wish CDNs and the Google font CDN. These would look something like this:
<link rel="preconnect" href="https://cdn.example.com/">
Or Early Hints might be a better option:
Link: <https://cdn.example.com>; rel=preconnect
Testing each would tell which is more fruitful, but note that Early Hints can be problematic to setup & keep “current”.
Again, just including the content and CSS in the initial HTML doc, and adding a few preload links, really made a tremendous difference. If the other recommendations were included, you would likely see even better times.
Summary
There are very, very few “right” and “wrong” ways to do things in web development. Most things have arguably “better” and “worse” ways of doing things, but most often, each way has pros and cons, and those have to be weighed against one another, and should ideally be tested, to confirm what is the best way to do something for that specific situation.
So, while this article provides what I think is an improvement to the user’s experience, I have absolutely no idea what is happening within the walls of Wish.com, so therefore I cannot say “this is how it should be done”.
I am merely highlighting options that could improve the user experience. Whether or not these ideas should, or even can, be implemented into their process, is something for that team to look into and decide.
Again, the point of this article was to a) satisfy my curiosity, and b) demonstrate how someone might investigate, and try to improve upon, a performance issue. And I think I have done that. Thanks for joining me!
Resources
- Speedcurve’s Page Speed Benchmarks dashboard
- Speedcurve’s Introduction to the Page Speed Benchmark dashboard
- Google’s article introducing the Core Web Vitals
- Google’s article explaining Largest Contentful Paint (LCP)
- Parth Dangroshiya‘s Understanding SSG, SSR, CSR, and ISR in Next.js
- Rushi Patel‘s Server-Side Rendering (SSR) and Static Site Generation (SSG) in React: A Deep Dive
- Josh W. Comeau‘s Making Sense of React Server Components
- Anna Monus‘s An Introduction to React Server Components
- Mozilla Developer article for Early Hints
- Mozilla Developer article for the `preload` link
- Mozilla Developer article for the `fetchpriority` attribute
Happy optimizing,
Atg