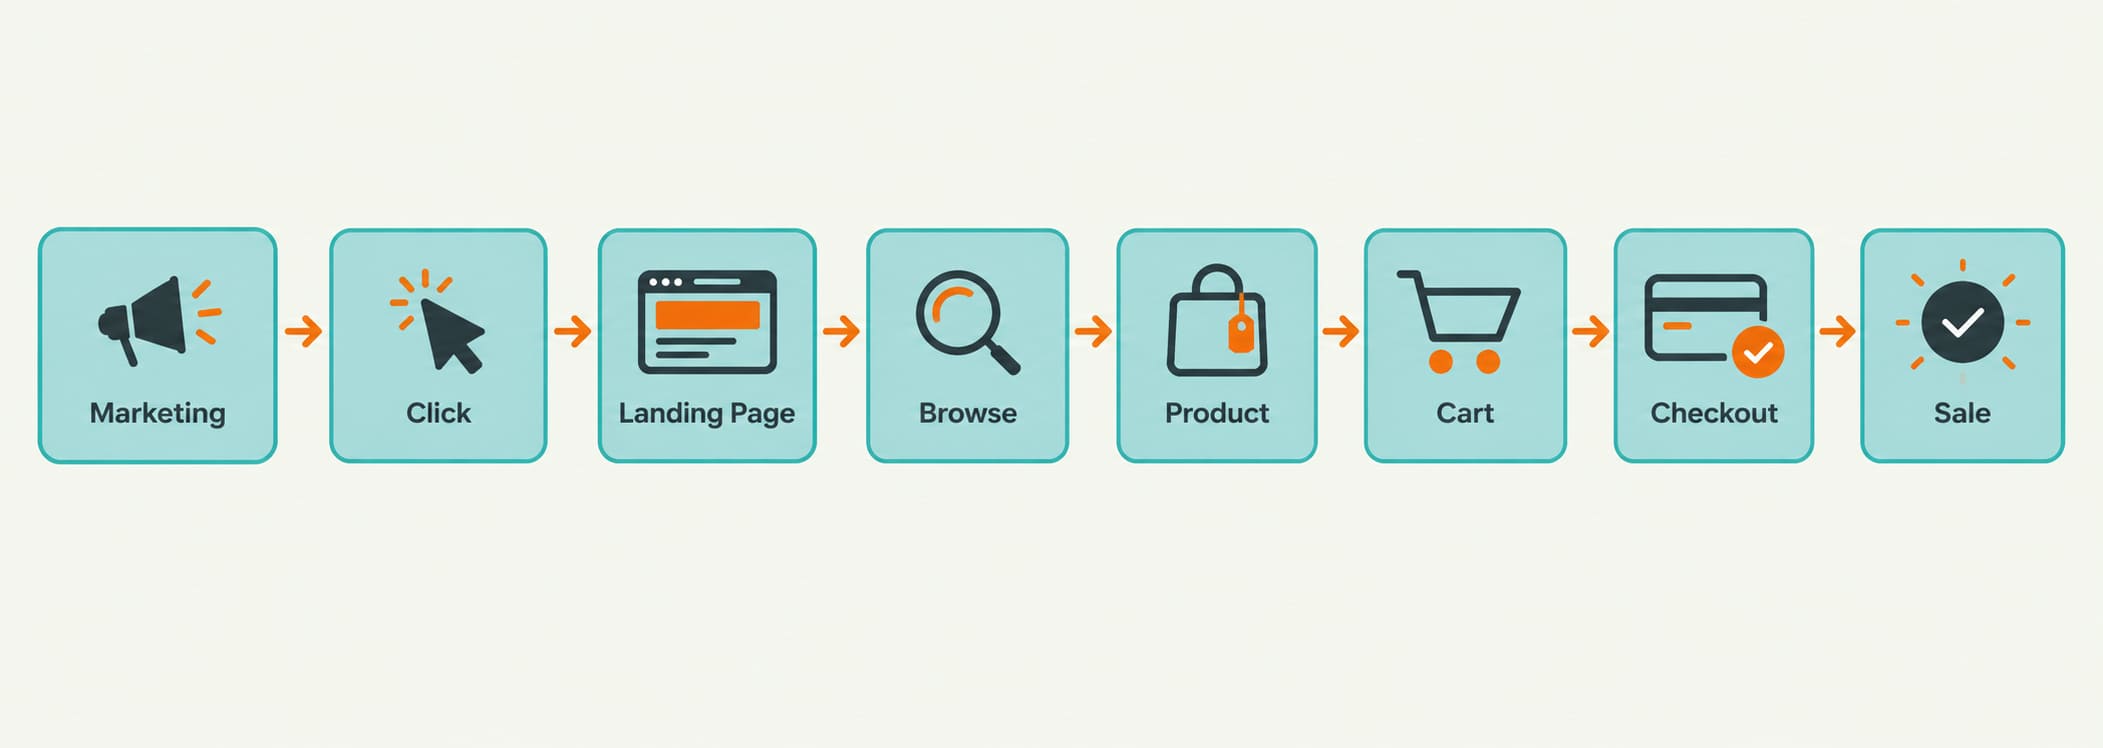
In the first article in this series, we looked at why web performance matters:
Your marketing campaigns can bring customers to your website, but your website still has to get them through the door.
In the second article, we learned how to recognize web performance problems and use the three Core Web Vitals to describe, and measure, three important parts of the customer experience: loading, interactivity, and stability.
But knowing what a performance problem is, and what it looks like, are only part of the challenge.
Websites are constantly changing.
New features are released.
New marketing campaigns go live.
Images and content are added and updated.
Third-party services change.
Developers optimize something and accidentally harm something else.
So how do you keep track of what your customers are actually experiencing, at any given time?
You monitor it.
Don’t wait for your customers to tell you
Imagine launching your biggest holiday campaign of the year.
The ads are running.
The email has gone out.
Social media is driving traffic.
Customers are arriving.
But somewhere along the way, something is causing user friction…
Maybe the page is suddenly loading slowly.
Or a promotional banner is causing unexpected layout shifts.
Or the “Add to Cart” button seems unresponsive.
Some nice customer may let you know about the problem.
Most will not.
And there goes your big holiday campaign…
That is why performance monitoring is so valuable.
It lets you identify problems without waiting for your customers to report them.
Real-User Monitoring: What are real customers experiencing, right now?
The first piece of the puzzle is Real-User Monitoring, commonly shortened to RUM.
RUM collects actual performance data from actual people using your actual website in the wild.
That means you aren’t looking at a theoretical experience.
You are looking at what is happening to real customers using real devices, real browsers, and real network connections.
RUM can track metrics such as:
- TTFB (Time to First Byte),
- FCP (First Contentful Paint),
- LCP (Largest Contentful Paint),
- CLS (Cumulative Layout Shift),
- INP (Interaction to Next Paint),
- and many other page and user-experience measurements.
It can also segment that information by things such as:
- device type,
- browser,
- geography,
- page,
- connection,
- and other dimensions depending on the monitoring platform.
This can reveal patterns that would be impossible to discover by simply visiting the website yourself.
For example, your desktop experience might look perfectly fine from the office.
But your real customers might be on a mobile device, using a spotty 4G connection.
RUM can tell you when something changes
This is where those Core Web Vitals become especially useful.
In the previous article, we looked at the thresholds that help us understand whether LCP, CLS, and INP represent a “good”, “needs-improvement”, or “poor” experience.
Those thresholds don’t just help us evaluate a website.
They can also become monitoring targets.
A RUM dashboard can show whether or not your customers are currently experiencing good performance.
It can show trends over time.
And it can automatically alert your team when performance crosses a threshold or begins moving in the wrong direction.
For example:
- LCP was good last month. Now it isn’t.
- CLS has suddenly increased.
- INP has deteriorated since yesterday’s release.
Those are signals that deserve investigation.
The important part is the timing.
Instead of discovering the problem weeks or months later, your team can start investigating as soon as your monitoring sees it!
RUM gives you the customer’s perspective
This is one of the most important ideas in performance monitoring:
Your experience isn’t necessarily the same as your customers’ experience.
Your developers likely have fast computers.
Your office likely has a fast internet connection.
Your own browser may have cached many of the resources your customers need to download.
Your customers may be using an older phone, a slower connection, or a completely different browser.
It gives you a much better picture of your audience’s actual experience.
And during the holiday shopping season, that information becomes particularly valuable.
When marketing is driving more customers to your website, you want to know what those customers are experiencing right now.
Not what your development team experienced, yesterday, from their office computer.
Reports turn data into something you can act on
Raw performance data isn’t particularly useful if nobody looks at it.
A good monitoring system turns that data into reports and dashboards that help your teams understand what is happening.
You might see:
- LCP: Getting worse on mobile product pages.
- CLS: Increasing across pages using a new promotional component.
- INP: Increasing after a JavaScript release.
Those observations can lead directly to investigation.
The goal isn’t to stare at charts all day.
The goal is to make performance visible.
When performance becomes easier for your team to see, discuss, and track, it also becomes easier to make part of the normal development and marketing process.
Alerts help you respond before the problem gets expensive
Reports tell you what has happened.
Alerts tell you what is happening.
Imagine that a new release goes live on Tuesday afternoon.
By Tuesday evening, your RUM data is showing an increase in INP.
Without monitoring, you might not discover the problem until someone reports that the website feels slow.
With monitoring, your team receives an alert and begins investigating much sooner.
In fact, too many alerts can quickly become noise.
The goal is to establish meaningful thresholds and trends that tell your team:
“Something has changed. You should look at this.”
That can be especially important during a major holiday campaign.
The more traffic you are paying to send to your website, the more expensive a performance problem is.
Synthetic Monitoring: What happens when we test the website ourselves?
RUM tells us what real customers are experiencing.
But there is another useful piece of the puzzle:
Synthetic Monitoring, sometimes called Lab Monitoring.
Instead of collecting data from real users, synthetic monitoring repeatedly tests your website under controlled conditions.
You can define things such as:
- Device
- Browser
- Location
- Network conditions
- Pages to test
- User journeys
- Testing frequency
That makes synthetic monitoring particularly useful for identifying changes over time.
For example, you could test your homepage, a product listing page, and a product detail page every hour.
If the LCP suddenly increases after a deployment, you have a clear signal that something changed.
If a page’s JavaScript becomes significantly heavier, your synthetic test can reveal it.
If a critical customer journey becomes slower, you can investigate before waiting for enough RUM data to accumulate.
Synthetic monitoring gives you a controlled baseline
There is another important advantage.
Real users are unpredictable.
That’s useful because it reflects reality.
But it can also make individual measurements difficult to compare directly.
Synthetic monitoring gives you a more controlled environment.
You can run the same test against the same page using the same device and network conditions over and over.
That makes it easier to answer questions like:
- Did this release make the page slower?
- Did our optimization actually improve performance?
- Has this page been getting progressively heavier?
- Did something change after we added this new feature?
RUM and synthetic monitoring aren’t competing approaches.
They answer different questions:
- RUM: What are our customers experiencing?
- Synthetic: How is our website behaving under controlled conditions?
Together, they provide a much more complete picture.
CI Monitoring: Find performance issues before you have them
There is one more step we can take.
What if you didn’t have to wait for RUM or synthetic monitoring to tell you that a new release had made the website slower?
What if you could catch the problem before it went live?
That’s where performance testing can become part of your CI/CD process.
Every time developers make changes to the website, those changes can pass through automated tests before they are released.
For example, a build could be tested to make sure:
- JavaScript bundles haven’t grown unexpectedly.
- Critical pages haven’t become significantly slower.
- LCP hasn’t regressed beyond an acceptable threshold.
- Layout stability hasn’t deteriorated.
- Important interactions haven’t become substantially less responsive.
- Performance budgets haven’t been exceeded.
If a change creates a significant regression, the build can be flagged before it reaches production.
This changes the conversation!
Instead of:
“Something is wrong with the website.”
You have:
“This change would make the website slower.”
The developer who introduced the change can investigate it while the code is still fresh in their mind.
And more importantly, before it gets to your live server.
So your customers never have to experience the problem!
From finding problems to preventing them
This gives us three different ways to think about web performance monitoring:
-
RUM: Detect what’s currently happening
What are our real customers experiencing?
RUM helps you understand the current state of the customer experience and identify problems affecting real users. -
Synthetic Monitoring: Track the constant state
How is our website behaving over time?
Synthetic monitoring provides consistent, repeatable testing that can help identify regressions and changes in performance. -
CI Performance Testing: Prevent problems from going live
Did we just introduce a performance problem?
Automated performance checks can catch regressions before a release reaches production.
Together, this monitoring approach creates a performance feedback loop:
The goal isn’t simply to make a website fast once.
It is to keep it performing well as the website changes.
Don’t waste your holiday marketing budget on a performance problem
This brings us back to where we started.
Your marketing team is spending money to bring customers to your website.
Those customers are going to arrive expecting to shop, compare, and buy.
You don’t want to find out about unnecessary friction after the campaign is over.
You want to know while it is happening!
And even better, you want to catch problems before they happen.
That’s the real value of performance monitoring.
None of these replace investigation and optimization.
They make that work faster, more measurable, and more proactive.
And when the holiday traffic starts arriving, that can be the difference between creating customers for you, and creating customers for someone else.
Find Your Biggest Web Performance Opportunities
Performance monitoring can tell you that something is wrong.
It can tell you when it changed.
And it can help you understand who is being affected.
But you still need to determine what to fix, why it matters, and where your team should spend its time.
My Web Performance Assessment combines real-user performance data, Core Web Vitals, and targeted investigation to identify the performance issues that may be creating the most meaningful friction in your customer journeys.
Rather than treating every performance problem equally, I prioritize opportunities based on their potential business impact, so your team can focus its time and performance budget where it matters most.
Know where to invest your performance budget before you spend it.
Learn more about Web Performance & Optimization →
What’s next?
This concludes our introduction to web performance for the upcoming holiday shopping season.
We’ve looked at why web performance matters, how to recognize performance problems, how Core Web Vitals help us measure those problems, and how Performance Monitoring can help find and prevent performance issues.
But knowing that a problem exists is only the beginning.
The next question is:
What should you actually do about it?
That’s where a deeper performance assessment can help.
If you’d like help getting setup, or even just want to talk about the idea, let me know. I love talking about performance issues almost as much as I love fixing them…